NPS vs CSAT vs CES: Which Customer Feedback Metric Should Your Business Track in 2026?
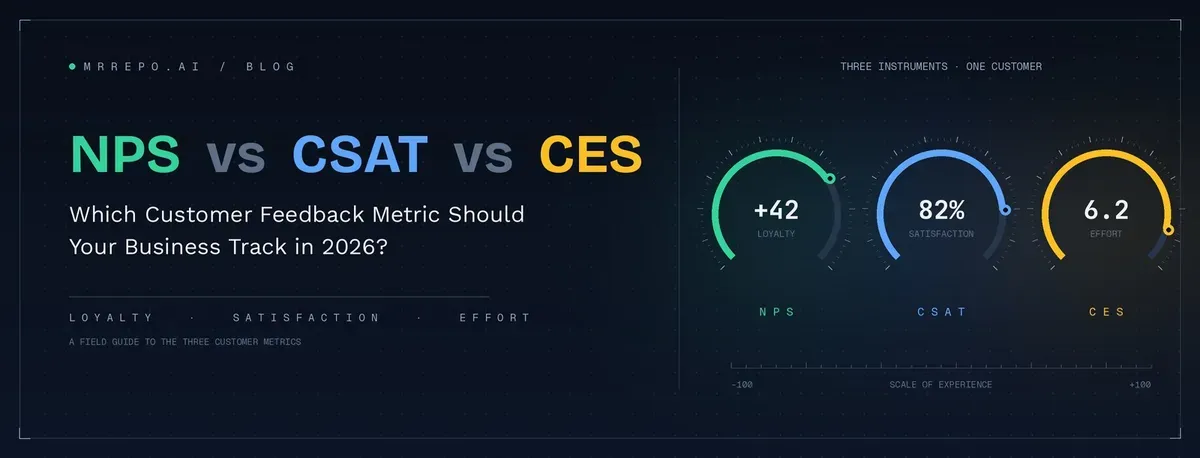
NPS vs CSAT vs CES: Which Customer Feedback Metric Should Your Business Track in 2026?
You ask a customer "How did we do?" and they say "Fine." What does that actually tell you? Will they come back? Would they recommend you to a friend? Was anything about their visit frustrating?
Three little acronyms — NPS, CSAT, and CES — exist to turn that vague "fine" into numbers you can act on. But they measure very different things, and most small businesses either track none of them or track the wrong one for the question they're trying to answer.
This guide breaks down what each metric measures, how to calculate it, what a "good" score looks like, and — most importantly — which one deserves a place on your dashboard if you run a restaurant, salon, clinic, or any local business.
The Quick Answer: What Each Metric Measures
If you only have thirty seconds, here's the whole article in one table:
| Metric | The question it answers | Best for measuring |
|---|---|---|
| NPS (Net Promoter Score) | "Would you recommend us?" | Long-term loyalty and word of mouth |
| CSAT (Customer Satisfaction Score) | "Were you happy with this?" | Satisfaction with a specific visit, order, or interaction |
| CES (Customer Effort Score) | "Was this easy?" | Friction in a specific process — booking, checkout, support |
NPS looks at the whole relationship. CSAT looks at one moment. CES looks at one process. That's the core difference — everything else is detail.
What Is NPS (Net Promoter Score)?
Net Promoter Score measures customer loyalty by asking one question: "On a scale of 0–10, how likely are you to recommend us to a friend or colleague?"
The metric was introduced by Fred Reichheld of Bain & Company in a 2003 Harvard Business Review article, and it has since become the most widely benchmarked loyalty metric in the world.
How to Calculate NPS
Responses fall into three groups:
Promoters (9–10): Loyal enthusiasts who will recommend you
Passives (7–8): Satisfied but unenthusiastic — vulnerable to competitors
Detractors (0–6): Unhappy customers who may spread negative word of mouth
NPS = % Promoters − % Detractors
The result ranges from −100 to +100. If 50 customers respond and 30 are Promoters, 10 are Passives, and 10 are Detractors, your NPS is 60% − 20% = +40.
What Is a Good NPS Score?
Anything above 0 means you have more fans than critics. Industry data compiled by Retently for 2026 puts most industry averages between roughly 26 and 68 — healthcare averages around 37, ecommerce and retail around 61, and consumer financial services as high as 68. As a rule of thumb: above 30 is strong, above 70 is exceptional, and below 0 signals serious problems to fix.
NPS Strengths and Limitations
Strengths: It's simple, universally benchmarkable, and correlated with repeat business and referrals — the lifeblood of local businesses.
Limitations: A score alone doesn't tell you why customers feel the way they do. A "3" could mean slow service, a rude interaction, or a billing mistake. NPS always needs a follow-up question ("What's the main reason for your score?") to be actionable.
What Is CSAT (Customer Satisfaction Score)?
CSAT measures satisfaction with a specific, recent experience: today's meal, this haircut, this appointment. The typical question is "How satisfied were you with your visit?" answered on a 1–5 scale (or with stars or smiley faces).
How to Calculate CSAT
CSAT = (Number of satisfied responses ÷ Total responses) × 100
"Satisfied" usually means the top two ratings — 4s and 5s on a 5-point scale. If 80 of 100 respondents pick 4 or 5, your CSAT is 80%.
What Is a Good CSAT Score?
Most businesses aim for 75–85%. Consistently above 85% is excellent; below 70% means a meaningful share of customers are leaving unhappy — and, as we covered in The Silent Customer Problem, most of them won't tell you before they stop coming back.
CSAT Strengths and Limitations
Strengths: Immediate and specific. Because it's tied to a single visit or interaction, you know exactly what experience the score refers to. It's also the easiest metric for customers to answer — one tap on a scale.
Limitations: Satisfaction today doesn't guarantee loyalty tomorrow. A customer can rate a meal 5/5 and still switch to the new restaurant across the street next week. CSAT is a snapshot, not a forecast.
One note on terminology: customer satisfaction (a feeling about one interaction) is not the same as customer experience (the sum of every interaction). We've unpacked that distinction in Customer Experience vs Customer Satisfaction.
What Is CES (Customer Effort Score)?
CES measures how easy it was for a customer to get something done — book an appointment, place an order, resolve a complaint. The standard question: "How easy was it to [book your appointment / place your order / get your issue resolved]?" rated on a 1–7 or 1–5 scale from "very difficult" to "very easy."
The metric comes from 2010 research published in Harvard Business Review ("Stop Trying to Delight Your Customers"), which found that reducing effort predicts loyalty better than delighting customers does. People rarely rave about a business because checkout was easy — but they absolutely leave when it's hard.
How to Calculate CES
CES = Sum of all responses ÷ Number of responses
It's a simple average. If five customers rate the ease of booking as 6, 7, 5, 6, and 7 on a 7-point scale, your CES is 31 ÷ 5 = 6.2.
What Is a Good CES Score?
On a 7-point scale, an average above 5 generally indicates a low-effort experience. More useful than the absolute number is the trend: if your CES drops after you change your booking system or menu, the change added friction.
CES Strengths and Limitations
Strengths: Highly predictive of repeat behavior, and it points directly at fixable process problems.
Limitations: Narrow by design. It tells you a process was hard, not whether the customer liked the outcome — a booking can be effortless and the appointment itself disappointing.
NPS vs CSAT vs CES: Side-by-Side Comparison
| NPS | CSAT | CES | |
|---|---|---|---|
| Question | How likely are you to recommend us? | How satisfied were you? | How easy was it? |
| Scale | 0–10 | 1–5 (typically) | 1–7 or 1–5 |
| Formula | % Promoters − % Detractors | % giving top-2 ratings | Average of responses |
| Score range | −100 to +100 | 0–100% | 1–7 (or 1–5) |
| Time horizon | Long-term relationship | One interaction | One process |
| Good score | 30+ | 75–85%+ | 5+ (on 7-pt scale) |
| When to ask | Periodically (e.g., quarterly) or after milestones | Right after a visit or purchase | Right after a specific task |
| Watch out for | Needs follow-up "why" | Doesn't predict loyalty | Ignores outcome quality |
Which Metric Should a Small Business Choose?
Here's the honest answer most articles avoid: for most local businesses, CSAT is the right starting point — not NPS.
NPS became famous in the B2B and SaaS world, where customers are surveyed a few times a year. But a restaurant or salon lives and dies by individual visits. When feedback is collected at the moment of experience — for example, when a customer scans a QR code at the counter or on the receipt — a satisfaction question about that visit produces the most specific, actionable data.
A practical progression:
Start with CSAT on every visit or transaction. It's the easiest question to answer and gives you a per-location, per-day pulse.
Add an open-text follow-up ("What could we improve?"). The comment is often worth more than the score. Our list of 75 customer feedback questions has ready-to-use wording.
Add CES when you suspect friction — a new online booking flow, a new ordering system, a complaint-handling process.
Add NPS once you have a feedback rhythm, asking monthly or quarterly to track whether day-to-day satisfaction is compounding into real loyalty.
One caution: keep surveys short. A QR-code survey that asks all three questions plus demographics will simply get abandoned. One score question plus one open comment is the sweet spot for in-person businesses.
Turning Scores Into Decisions
A score you don't act on is just decoration. Whichever metric you choose, the loop is the same:
Segment the results. A 78% CSAT overall may hide an evening-shift problem: 90% at lunch, 62% at dinner. Averages bury the story; segments reveal it.
Read the comments behind the numbers. The score tells you that something changed; the open-text tells you what.
Close the loop with unhappy customers privately. A detractor who receives a genuine response often becomes a repeat customer — and resolving issues privately means they never need to become a 1-star public review.
Track trends, not single data points. One bad week is noise. Three declining months is a signal.
We've covered the mechanics of this in more depth in our guide to customer feedback analytics.
Frequently Asked Questions
Can I use NPS, CSAT, and CES together?
Yes — they're complementary, not competing. Many businesses use CSAT after each transaction, CES after specific processes, and NPS periodically. Just don't ask all three in one survey; survey fatigue will crush your response rates.
How often should I send each survey?
CSAT and CES: immediately after the interaction they measure, while the memory is fresh. NPS: monthly or quarterly, and never to the same customer more than once a quarter.
What's a good survey response rate?
In-person feedback via QR codes typically outperforms email surveys because you're catching customers at the moment of experience. Whatever your channel, comparing your own response rate month over month matters more than external benchmarks — a falling response rate is itself a warning sign.
Is a high CSAT score enough to grow my business?
No. CSAT confirms customers are happy today; it doesn't tell you whether they'll return or recommend you. That's why maturing feedback programs layer NPS on top of CSAT — satisfaction is the foundation, loyalty is the goal.
Do these metrics affect my Google reviews?
Indirectly, but powerfully. Businesses that measure satisfaction consistently catch problems before they become public 1-star reviews, and happy customers identified through feedback are your best source of authentic positive reviews — collected compliantly, with every customer offered the same options.
The Bottom Line
NPS, CSAT, and CES aren't rivals — they're three lenses on the same customer. CSAT tells you how the visit went, CES tells you where the friction is, and NPS tells you whether it's all adding up to loyalty. For most local businesses, the winning play is simple: measure satisfaction at every visit, ask why, fix what you find, and let loyalty — and your reputation — compound from there.
Ready to start measuring? MrRepo lets your customers share feedback in seconds by scanning a QR code — no app, no login — and turns every response into a private, actionable inbox for your team. See how it works or set up your first feedback QR code in about two minutes.
Sources: Fred Reichheld, "The One Number You Need to Grow," Harvard Business Review (2003); Dixon, Freeman & Toman, "Stop Trying to Delight Your Customers," Harvard Business Review (2010); Retently, 2026 NPS Benchmarks by Industry; CustomerGauge, "NPS vs CES vs CSAT."