The Review Benchmarks You Won't Find for Your Business — and What to Measure Instead
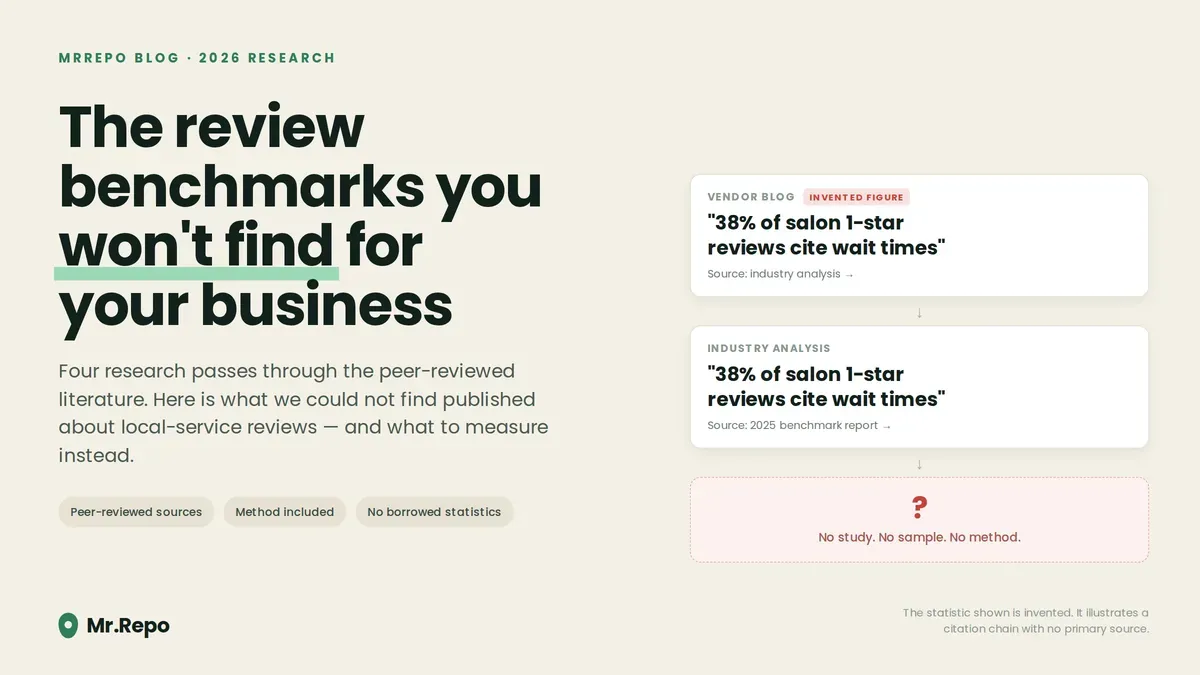
You want one number. Something like — and this is a figure we have just invented to make the point — "In salons, 38% of one-star reviews are about wait times." With that number you could walk into Monday's staff meeting and point at a problem.
So you search for something like it. And you find figures of that shape on several sites, phrased several ways. When we followed them, none reached a study.
We have now spent four research passes looking for benchmarks like that one, for posts on this blog about what customers complain about, what replying actually changes, and how many reviews are worth answering. Each time we went to the peer-reviewed literature first, and each time we came back with the same finding: for a local service business, the benchmark you want has not been published.
That is worth saying out loud, because the alternative — quietly using a number somebody invented — is how you end up managing your business against fiction. Here is what is missing, and what your own reviews can tell you instead.
Gap 1: We found no study of what your customers complain about
There is real research on complaint categories in online reviews. It is just not about you.
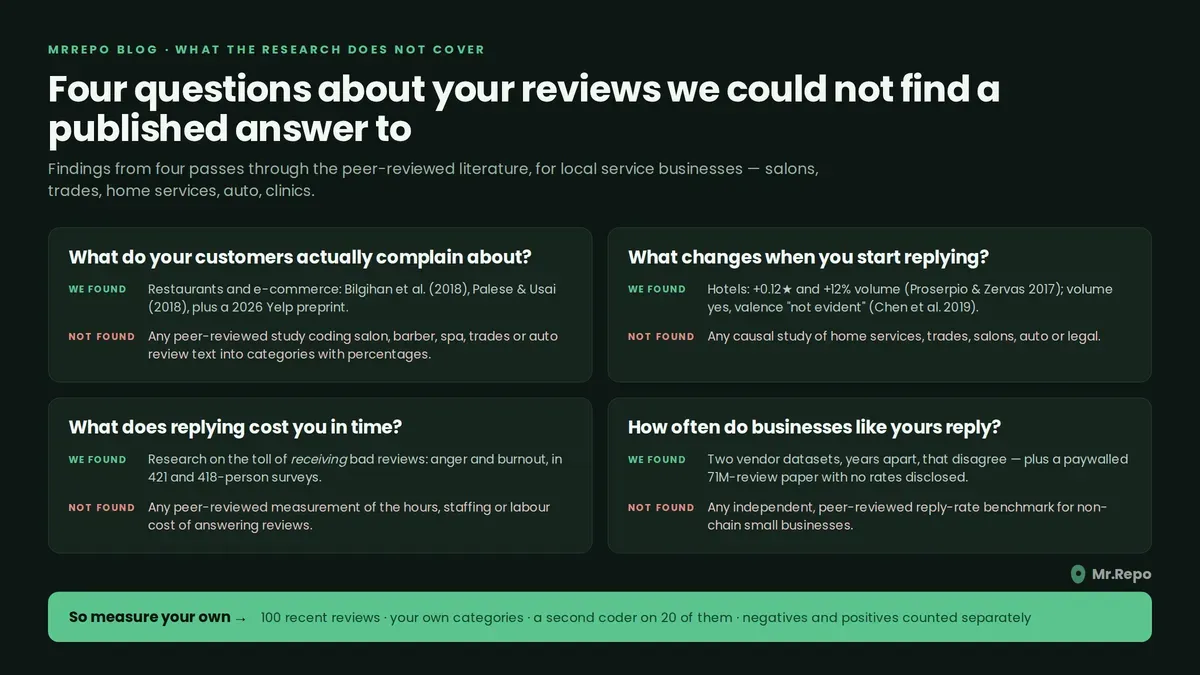
Bilgihan, Seo and Choi (2018), in the Journal of Hospitality Marketing & Management, analysed 2,214 Yelp reviews and reported that "people tend to not to complain about the food as much as they do for service related issues." Palese and Usai (2018), in the International Journal of Information Management, coded 27,117 reviews from an Italian price-comparison site and found responsiveness discussed in 24.11% of five-star reviews but 89.03% of one-star ones — a comparison of the two extremes only, not of all positive reviews against all negative ones. A 2026 preprint from a University of Southern California team — not yet peer-reviewed — human-labelled 5,000 reviews from the general Yelp dataset and, in the 1,000-review validation split, counted service in 191 negatives, food quality in 160 and wait time in 84.
Two peer-reviewed studies of restaurants and e-commerce, plus a preprint on a mixed Yelp dataset that never breaks results out by industry. That is the literature.
For salons, barbershops, spas, home services, trades, auto repair or pet care, we found no peer-reviewed study that codes online review text into complaint categories and reports percentages. The closest thing is Lee and Kim (2020) in Fashion and Textiles, which collected 570 survey responses from Korean female consumers and used structural equation modelling to identify three dissatisfaction dimensions in hairdressing — material services, human response services, and hairstyling services. It is careful work, and it is a survey rather than an analysis of reviews on your Google profile, reporting no category percentages.
So when a page tells you the top three salon complaints, ask where the number came from. We could not find a published source it could have come from.
Gap 2: Almost everything known about replying comes from hotels
The best evidence on management responses comes from a handful of observational and quasi-experimental studies of hotel platforms. Proserpio and Zervas (2017) in Marketing Science reported a 0.12-star increase in ratings and a 12% increase in review volume for responding hotels, alongside fewer but longer negative reviews. Chen, Gu, Ye and Zhu (2019) in Information Systems Research found a significant positive impact on the volume of subsequent reviews, but reported that the impact on review valence "is not evident." Wang and Chaudhry (2018) in the Journal of Marketing Research found responses to negative reviews can significantly influence subsequent opinion in a positive direction when visible at the time of reviewing — while responses to positive reviews carried a negative externality.
Hotels. Hotels. Hotels.
Outside hospitality the evidence thins to almost nothing. Choi, Lee, Kwak and Min published a restaurant study in Electronic Markets in November 2025, covering 43,747 reviews at 56 restaurants against a control of 27,952 at 37 — but it measures the content of subsequent reviews, their length, cognitive language and affective tone, not ratings or volume. Jin, Wang, Liu and Yu (2025) in Production and Operations Management found roughly a one-star upgrade from responding, but their paper is titled "When Politeness Backfires" because the effect got smaller the more polite the response — and it studies a Chinese mobile-game app store, where the upgrade comes from the same reviewer revising their own rating.
For home services, trades, salons, auto or legal, we found no causal study at all. That does not mean replying is useless. It means the confident number you were about to borrow was measured on a hotel.
Gap 3: We could not find a study of what replying costs you
This gap surprised us most, because the question is so obvious: how long does it take to reply to a review? Four research passes turned up nothing peer-reviewed. Almost every hit we checked was a vendor blog with an unsourced figure.
There is research on what receiving bad reviews does to people. Bradley, Sparks and Weber (2016), in the Journal of Service Management, surveyed 421 restaurant owners, managers and employees and reported that "many respondents reported feelings of anger and use of maladaptive coping strategies," with smaller numbers reporting embarrassment, guilt, and thoughts of leaving the industry. Weber, Bradley and Sparks (2017) surveyed 418 US hospitality workers and found that, in their model, anger statistically mediated the association between receiving negative reviews and two measures of burnout. Both are cross-sectional self-report.
Note what those measure: receiving reviews. Neither times the work of answering them. We could find no study that does.
Gap 4: The only published reply-rate percentages come from vendors
We found two datasets, both published by companies with a commercial interest in review management — SOCi, a multi-location marketing platform, and UENI, a small-business website platform — and they disagree.
| Star rating | Share replied to — SOCi (4.9M reviews, 31,326 locations, 53 multi-location brands, 2015–2022) | Share replied to — UENI (229,882 reviews, small businesses, 18 months to Aug 2026) |
|---|---|---|
| 5-star | 23.4% | 29.3% |
| 4-star | 4.6% | 12.9% |
| 3-star | 2.0% | 10.2% |
| 2-star | 3.3% | 13.9% |
| 1-star | 8.6% | 9.8% |
Start with the caveats. SOCi's window closed in July 2022 and UENI's opened in early 2025, so they describe different periods. SOCi's locations belong to 53 multi-location chains, not independent small businesses. And both samples are self-selected — businesses already on a vendor platform, which makes them a generous benchmark rather than a typical one.
They agree that five-star reviews get answered most and four-star reviews rank third. The rankings flip elsewhere: one-star reviews rank second in SOCi's data and last in UENI's, though the one-star rates are the closest of the five (8.6% vs 9.8%). That flip happens because UENI's two-, three- and four-star rates all sit above its one-star rate, not because the two disagree about one-star reviews.
The largest dataset on this question is Khoushinsky and Kokotov's February 2026 paper in Marketing Letters, built on 71 million Google reviews across ten industries, which introduces a concept it calls structured selectivity. It is paywalled, it is descriptive rather than prescriptive, and its abstract discloses no reply-rate percentages. We found no independent, peer-reviewed reply-rate benchmark for non-chain small businesses.
Why the internet looks like it has answers
Search any of these questions and you get confident results. We did: the first page for small-business reply-rate benchmarks returned near-identical statistics pages from several review-software vendors, several citing each other rather than any underlying study.
We are not alleging deception. This is what happens when demand for a number exceeds the supply of research — someone estimates, someone else quotes the estimate, and by the fourth repetition it has become a "study."
The tell is usually the same. Follow the link. If it goes to another blog post, and that one to a third, and none reaches a journal, a government dataset, or a named methodology, you are looking at a rumour with good typography.
What your own reviews can actually tell you
Here is the useful part. You were probably not going to act on an industry average anyway. You were going to act on your problem — and your reviews contain your problem.
What they cannot deliver is precision. Set aside that people who leave reviews are self-selected — no formula corrects for that, and it makes everything below a best case. Even the sampling error alone is large. At 95% confidence, for a category appearing in roughly 30% of the reviews you read:
| Reviews read | Margin of error |
|---|---|
| 30 | ±16.4 percentage points |
| 50 | ±12.7 points |
| 100 | ±9.0 points |
| 200 | ±6.4 points |
Read 50 reviews, find "wait time" in 30% of them, and the honest statement is roughly 17% to 43%. That still tells you wait time is a real and recurring theme. What it cannot support is a claim that wait time (30%) is a bigger problem than parking (20%).
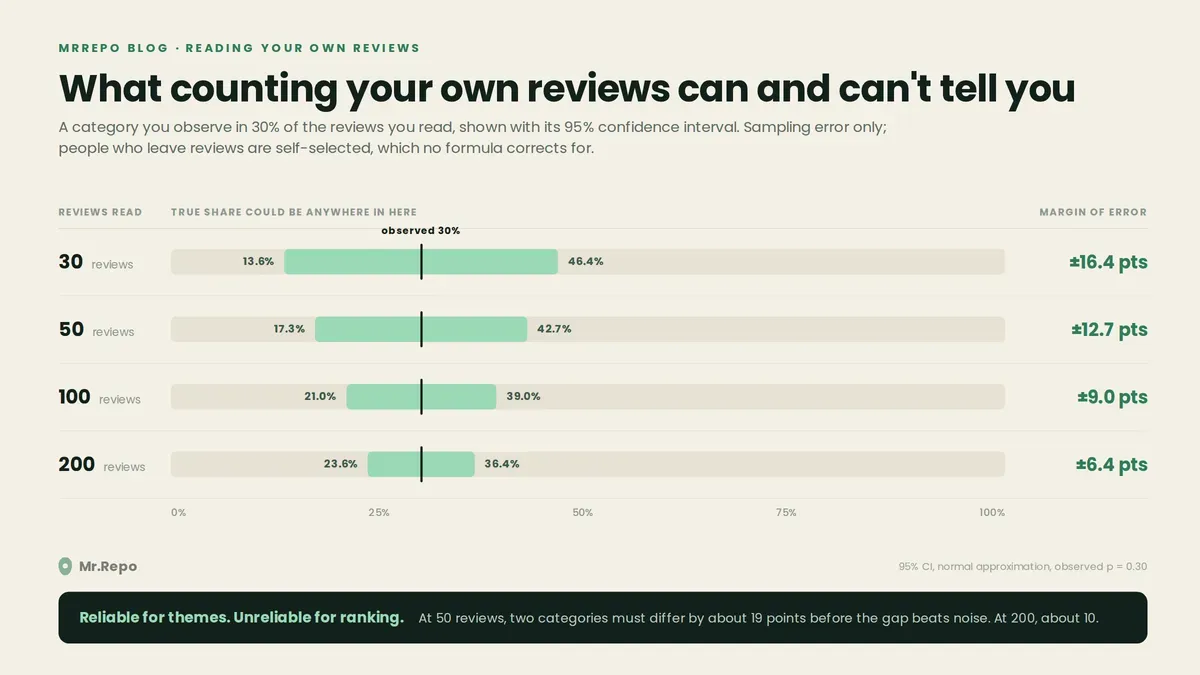
Comparing two categories is harder still, because both are counted on the same set of reviews. As a rough guide, at 50 reviews a gap smaller than about 19 points is not distinguishable from noise; at 100 reviews, about 14 points; at 200, about 10. Treat those as floors rather than tests — comparing five or six categories at once raises the chance of one gap looking real by accident.
The practical rule: your own reviews are reliable for finding themes and unreliable for ranking them. Treat a category that appears repeatedly as a signal. Treat a difference of a few points between two categories as no difference at all.
Themes, usefully, tend to show up early. Guest, Bunce and Johnson (2006), in Field Methods, found thematic saturation arriving within the first twelve of 60 in-depth interviews with women in two West African countries — interviews, not reviews, and a very different population, so a hint rather than a rule. It is proportions that need volume.
The quarterly self-benchmark
Do this once a quarter. The specific numbers below are our own working heuristics, not findings — there is no established standard for this kind of informal coding.
1. Get your reviews out of Google. As of writing we could find no one-click CSV export in the Business Profile dashboard — worth re-checking, as the interface changes. The Business Profile API lists reviews for a verified location but requires OAuth setup and developer work, so for most small businesses copying into a spreadsheet by hand is the practical option.
2. Take the most recent 100, or all of them if you have fewer. Recency keeps findings actionable — BrightLocal's 2026 survey of 1,002 US adults found 74% say they prioritise reviews from the last three months, so a 2023 theme may be a problem you already fixed. Fewer reviews means a wider margin of error, though.
3. Code them into categories you choose yourself. Do not import someone else's taxonomy. Read 20 first, write down the themes that actually appear in your business, then code the rest against that list. One review can carry two categories.
4. Have someone else code 20 of the same reviews blind. If you disagree on more than about one in five, your categories are too vague — split or merge them and start over. This step is boring and it is the one that keeps the exercise honest.
5. Count negatives and positives separately. The one study we found comparing the two — on e-commerce, and only one-star against five-star reviews — found responsiveness raised in 24.11% of the positives and 89.03% of the negatives. Praise and complaints may not be mirror images. Two lists, not one.
6. Write down what you will change, and the date. Then run it again next quarter and compare.
That last step is the whole argument. An industry benchmark tells you how you compare to businesses that are not yours, and controls for almost nothing that makes yours different. Your own last-quarter number tells you whether what you did worked.
Frequently asked questions
Isn't some benchmark better than none? Not when it is wrong in an unknown direction. A fabricated figure tells you which problem to prioritise, and if it points the wrong way you spend a quarter fixing the wrong thing.
How do I know if a statistic I found is real? Follow the citation. A real one names a source you can open: a journal article with authors and a year, a government dataset, or a study with a stated sample size and method. If the trail is blog-to-blog, treat it as an estimate. Also check scope — many widely-quoted review statistics come from hotels or e-commerce and get repeated as if they described local services.
How many reviews do I need before this is worth doing? Themes surface early, so thirty is enough to notice what recurs — and nowhere near enough to put a percentage on it. Ranking categories stays unreliable at the volumes most small businesses have: at 100 reviews you need roughly a 14-point gap, at 200 about 10. With 40 reviews, run it anyway and write your conclusions as "wait times keep coming up" rather than "wait times are 30% of complaints."
Should I use AI to categorise my reviews? It can speed up step 3. Two cautions: it can invent categories that sound plausible, so give it your own list rather than asking it to generate one, and its labelling can be inconsistent, which makes step 4 matter more rather than less. Spot-check at least a fifth of its labels before trusting the rest.
Do I still need to reply to reviews if the research is this thin? Yes, for reasons that do not depend on the causal literature. BrightLocal's 2026 survey of 1,002 US adults found 89% say they expect owners to respond and 81% expect it within a week — stated preferences rather than measured behaviour, but they are what your prospective customers say they want. We covered how many reviews are worth answering separately.
Does this mean the research on reviews is useless? No — it is narrower than the way it gets quoted. Findings from hotel data are real findings about hotels. The failure is not the studies; it is the summarising.
Key takeaways
For salons, barbershops, spas, home services, trades and auto, we found no peer-reviewed study breaking review complaints into categories with percentages. What exists is two studies of restaurants and e-commerce, plus a preprint that does not report results by industry.
Almost all evidence on replying comes from hotels. One restaurant study measures review content rather than ratings, and one app-store study found a one-star upgrade that got smaller the more polite the response — its actual headline. For home services, trades, salons, auto or legal, we found nothing.
We found no peer-reviewed study measuring the time or staffing cost of replying. Two cross-sectional self-report surveys do link receiving negative reviews to anger — in 421 restaurant owners, managers and employees, and in 418 US hospitality workers, where anger statistically mediated two burnout measures.
The only published reply-rate percentages we found come from vendor platforms, one of them multi-location chains. Their windows are years apart and both samples are self-selected. They agree only that five-star reviews get answered most and four-star reviews rank third.
Your own reviews are reliable for identifying themes and unreliable for ranking them. At 50 reviews, two categories must differ by roughly 19 points before the gap is distinguishable from noise; at 200, about 10.
Run a quarterly self-benchmark: pull reviews out by hand, take the recent 100, code with your own categories, have a second person check 20, count negatives and positives separately, and compare to last quarter.
A business that collects its own feedback systematically gets data about the actual business, which an industry average cannot give it — within the precision limits above. MrRepo's QR-code feedback adds a private channel alongside your public reviews. It is a different and also self-selected sample, so count it separately rather than merging the two. See what a quarter of this kind of data looks like in the interactive demo.