What Customers Actually Complain About — and Why It's Not What Earns You 5 Stars
Most small business owners read a one-star review as a report card on the thing they sell. The restaurant owner reads a bad review and questions the menu. The salon owner reads one and wonders whether the cut was really that bad.
The research suggests that instinct is at least half wrong — and the half you're missing is the cheap half to fix.
Across three decades of service-quality and review-text research, one pattern shows up repeatedly: the attributes that earn praise and the attributes that draw complaints are not the same attributes, and they don't cancel out. But the literature is genuinely mixed, several serious studies cut against the simple version of this story, and almost none of it covers salons or home services at all.
Here's what actually holds up, what doesn't, and what to do given that the honest answer is "measure your own reviews."
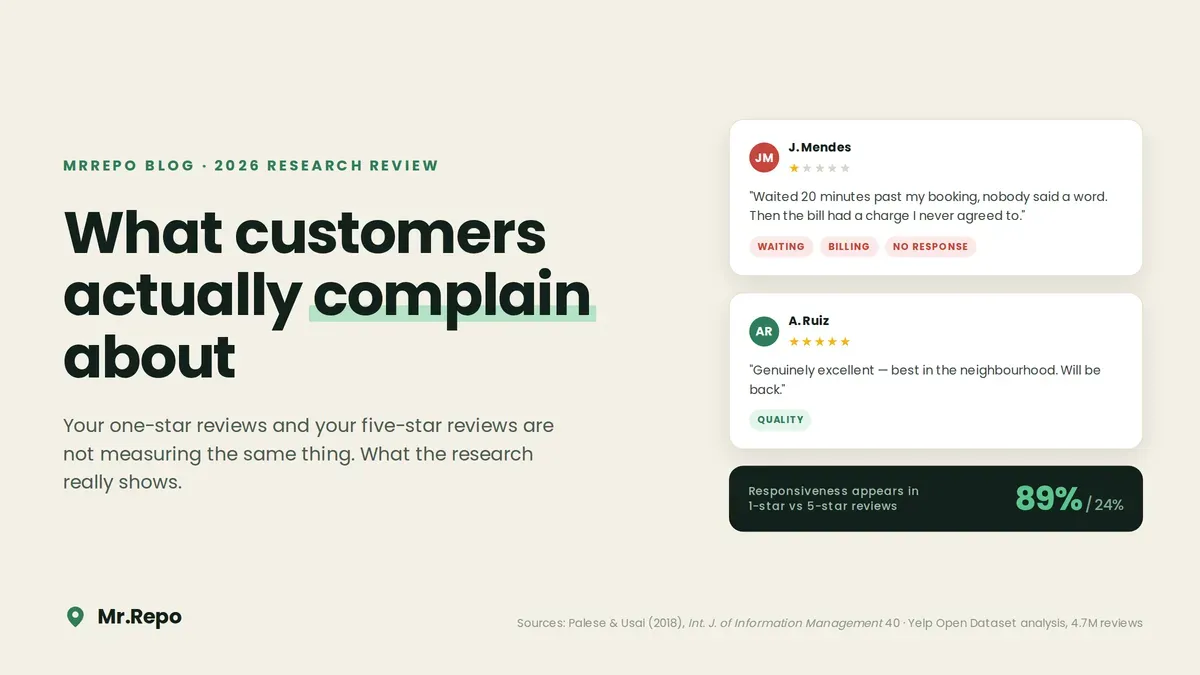
The sharpest measurement: 89% versus 24%
The cleanest number on this comes from an unlikely place — online merchants, not local businesses.
Palese and Usai, publishing in the International Journal of Information Management in 2018, ran 27,117 reviews (122,919 sentences) from an Italian price-comparison site through a classifier that sorted each sentence into one of the five classic SERVQUAL service-quality dimensions. Comparing one-star reviews against five-star reviews, they found:
"Responsiveness is discussed in only a quarter of positive reviews (24.11%) while almost all negative opinions address it (89.03%)."
Responsiveness — how quickly and willingly you deal with a customer who needs something — appeared in roughly nine out of ten one-star reviews and one in four five-star reviews.
Three caveats, because they matter. This is Italian e-commerce, not an American salon, so the number itself does not transfer. The 89/24 split comes from the extremes-only comparison, not from the study's regression. And the negative regression coefficient on responsiveness (−0.5817) does not mean responsiveness lowers ratings — it means responsiveness is what people write about when it has failed. That's salience, not causation.
Praise and complaints aren't mirror images
The formal name for this is the satisfier–dissatisfier distinction, drawn from Herzberg, Mausner and Snyderman's 1959 motivation research. Some attributes generate satisfaction when present. Others generate dissatisfaction when absent. They are not two ends of one scale.
Bilgihan, Seo and Choi tested this on 2,214 Yelp restaurant reviews in the Journal of Hospitality Marketing & Management (2018), and stated the result plainly:
"People tend to not to complain about the food as much as they do for service related issues."
Their word analysis found two distinct vocabularies: slow, rude, wrong order attached to service, while bland, greasy, mushy, dry, heavy attached to food.
That's two independent datasets showing the asymmetry directly. It is not, as some write-ups imply, a settled finding across the field — the rest of the literature is mixed, and the disagreement is worth understanding before you act on any of it.
Where the research disagrees with itself
Any article that shows you only the confirming studies is selling you something. Three serious pieces of work complicate this picture.
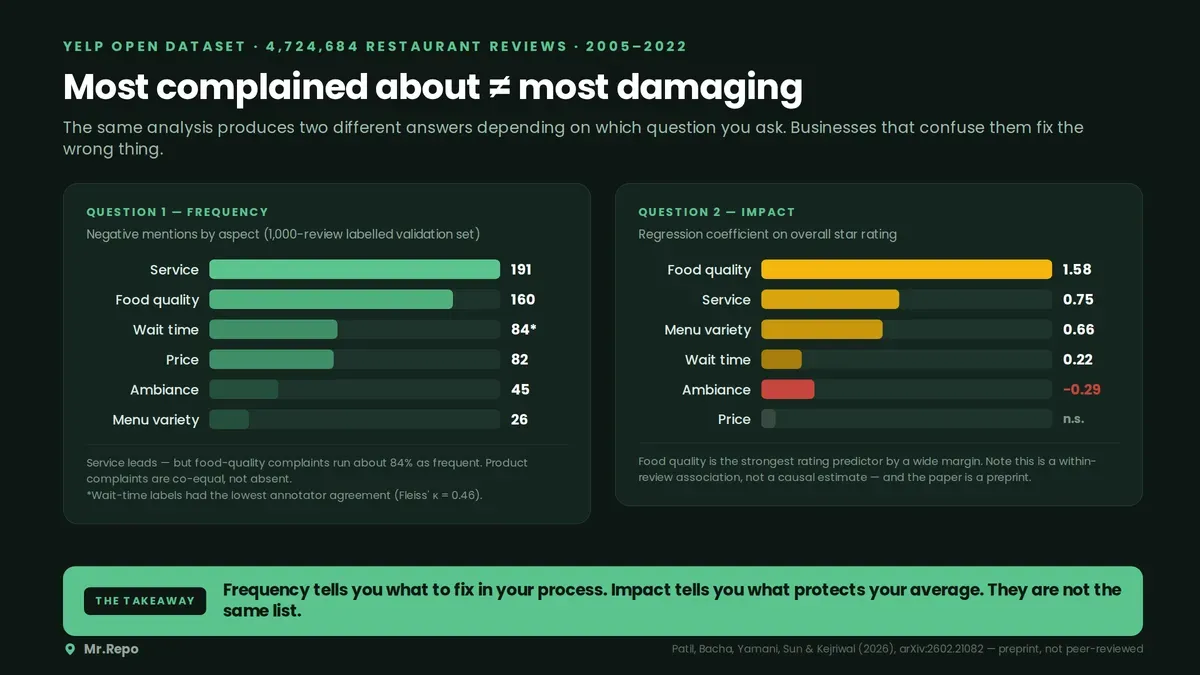
On impact, food quality dominates. A February 2026 preprint from a University of Southern California team (Patil, Bacha, Yamani, Sun and Kejriwal) analysed 4,724,684 Yelp restaurant reviews across 52,286 businesses in 17 US states and one Canadian province, 2005–2022. Regressing aspect sentiment on star rating, food quality scored 1.58 against service at 0.75 — more than double. Wait time came in around 0.22; price wasn't statistically significant. This is a preprint and has not been peer-reviewed. It's also a within-review association — aspect sentiment and star rating both come from the same text — so it shows what tracks with ratings, not what would change if you improved the food.
On frequency, service leads — narrowly. The same paper's 1,000-review human-labelled validation set counted negative mentions by aspect: service 191, food quality 160, wait time 84, price 82, ambiance 45, menu variety 26. Service is the most complained-about aspect in the same dataset where food is the strongest rating predictor. But note the gap: food-quality complaints run about 84% as frequent as service complaints. Product complaints are co-equal, not absent. (One caution: annotators agreed least on wait time, Fleiss' κ = 0.46, so that 84 is the softest number in the row.)
And in some samples, the product is simply king. Pantelidis, analysing 2,471 comments on 300 London restaurants (Cornell Hospitality Quarterly, 2010), found customers weighted attributes in the order food, service, ambience, price, menu, decor — and that ordering held steady through both a boom and a recession.
Frequency and impact are different measurements. Conflating them is how a business ends up rebuilding a menu when the actual problem is that nobody answers the phone — or the reverse.
What survives all of it: money, responsiveness, and the interaction itself
Strip out the sector-specific detail and three threads recur. None of them is universal, and the exceptions are worth naming.
Money surprises. The most recurrent thread here, and the one owners most often write off as a one-off. Keaveney's 1995 Journal of Marketing study of switching behaviour across 45 service industries — hairstylists and auto repair genuinely among them, coded from 800+ critical behaviours — found core service failure to be the largest single switching category at 44% of respondents, and that category folds billing errors in with service mistakes and service catastrophes. The paper doesn't break billing out on its own, and it reports a separate pricing category (high, unfair and deceptive pricing) at 30%. Namkung and Jang (Cornell Hospitality Quarterly, 2010, n = 491) found that among fine-dining customers, failures at the checkout-and-payment stage did the most damage to willingness to recommend — though in the same study, meal-consumption failures were the most damaging stage overall, with payment overtaking them only for fine diners' recommendations. And a 2025 JAMA Network Open analysis of 1,099,901 Yelp reviews across 138,605 healthcare facilities (2017–2023) found unfair payment the strongest negative topic correlation at r = −0.25.
Responsiveness and access. Getting hold of you, booking, rescheduling, someone picking up. Palese and Usai's 89% is the sharpest version; the JAMA data put "poor phone experience" third among negative topics at r = −0.23.
The interaction, not the outcome. Here the JAMA data cuts against the neat two-lever story, and it's worth being straight about that. The strongest correlations in the study were positive interpersonal ones — kindness in care at r = +0.32, allaying anxiety at +0.32, professionalism at +0.31 — larger in magnitude than any negative topic. So service manner is both the top satisfier and near the top of the dissatisfiers. It does not split cleanly. Clinical concern isn't absent either: malpractice ranks fifth among negative topics at r = −0.21. But the second-strongest negative, "poor treatment" (r = −0.24), is about being handled without care or dignity rather than about a clinical result. Reviews are mostly about the encounter, whichever direction they point.
Notice what none of these require: changing what you sell. That doesn't make product quality unimportant — in the Yelp data, food-quality sentiment tracks with ratings more strongly than anything else. It means there is a second, cheaper lever most owners never pull.
The complaints that never become reviews
There's a blind spot underneath all of this.
Formal complaint channels don't capture operational failure at local businesses. The FTC's Consumer Sentinel Network logged 6.47 million reports in 2024 — dominated by fraud (40.2%) and identity theft (17.5%), with home improvement, repair and solar at 1.27% and no personal-care category at all. Nobody files a federal complaint because the front desk never called back.
So for the failures that drive your one-star reviews, public reviews are the only record — which means you find out at the same moment your future customers do. And most unhappy customers never write one; they just don't return. We covered that gap in the silent customer problem.
The 2025 National Customer Rage Study (Customer Care Measurement & Consulting with Arizona State University's Center for Services Leadership, n = 1,000 US adults) found 77% of consumers hit a product or service problem in the past year, and that only 40% of those who complained were "delighted or completely satisfied" with the resolution. It's a self-reported survey and the full report isn't public — the figures come from the published release — but the direction is hard to dispute.
That's the argument for catching feedback on your own premises, before it's public, which is what a feedback QR code is for.
A 30-minute audit that beats any benchmark
Because the literature is mixed and your vertical probably has no study at all, the useful move is to measure your own reviews rather than import someone else's finding.
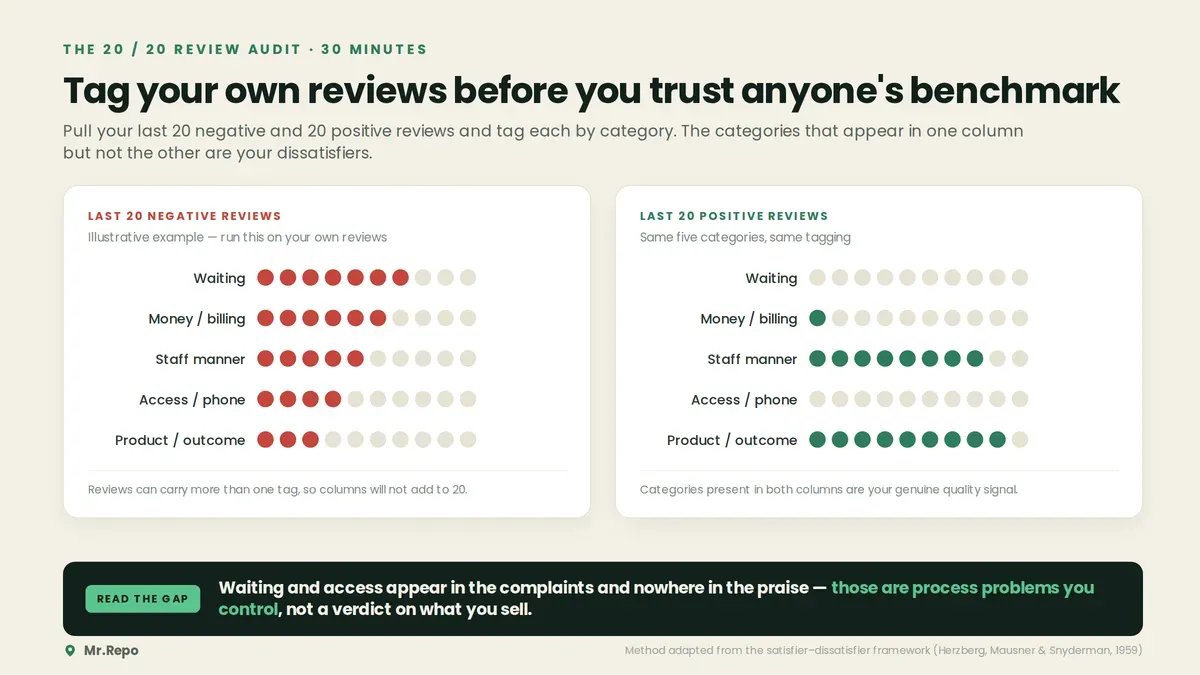
Pull your last 20 negative reviews. Tag each: product/service outcome, staff manner, waiting, money, or access. Reviews mentioning more than one get more than one tag.
Do the same for your last 20 positives.
Compare the two distributions. Categories that show up in negatives but rarely in positives are your dissatisfiers. Categories in both are your genuine quality signal.
Count money and access complaints separately. These recur across more of the sources here than anything else, and they're the two owners most reliably write off as flukes. One nuance: headline price ranked low in both Yelp datasets, so what shows up is unexpected charges, not being expensive.
Check your reply rate. Proserpio and Zervas (Marketing Science, 2017) found hotels that started responding gained about 0.12 stars and 12% more reviews, and afterwards received fewer but longer negative reviews — the authors attribute this to unhappy customers self-censoring short, indefensible complaints when they expect scrutiny, not to fewer bad experiences. Start with negative reviews, but reply to positive ones too.
If the audit shows most of your complaints are operational, that's good news: your problem is a process you control.
Frequently asked questions
Does this mean my product or service quality doesn't matter?
No. In the largest analysis cited here — a 4.7-million-review Yelp study, still an unreviewed preprint — food-quality sentiment tracked with star rating more than twice as strongly as service. Quality is what your average rests on. The narrower point is that quality is not what most of your complaints are about, so reading complaints as a pure quality signal will mislead you.
Why do one-star reviews so often mention things that seem trivial?
Because dissatisfiers work that way. Responsiveness, waiting and billing are largely invisible when they function and highly salient when they fail. A customer who waited eleven minutes with no explanation didn't get worse service delivered — they got a worse experience, and that's what gets written down.
Which complaint category should I fix first?
On the evidence here, money and access. Billing and payment problems surfaced near the top in three independent studies spanning switching behaviour, restaurant service stages and healthcare reviews. Access and responsiveness surfaced in Palese and Usai's e-commerce data and again in that same healthcare dataset. Both are process fixes rather than product fixes — though note that headline pricing ranked low in both Yelp datasets, so this is about surprise charges, not about being expensive.
How many reviews do I need before this analysis means anything?
Twenty of each is enough to see a pattern in a small business. You're comparing the shape of two distributions, not testing for significance. If a category shows up in eight of twenty negatives and none of twenty positives, you don't need a p-value.
Does the same pattern hold outside restaurants?
The direction holds in the e-commerce and healthcare data we could verify, and Keaveney's switching study covers salons and auto repair. But the peer-reviewed literature on salon, barber and home-services review text is thin — we could not locate a published text-mining study of salon reviews with complaint-category percentages. Treat the cross-sector pattern as a prior worth testing, not a fact about your vertical.
Should I respond differently to operational complaints than to quality complaints?
Yes. An operational complaint has a fix you can name and a date you can commit to, and saying so publicly is credible. A quality complaint usually needs an invitation to put it right in person. Generic replies fail at both — BrightLocal's 2026 consumer survey (n = 1,002 US adults) found generic or templated replies put off 50% of consumers.
Key takeaways
Praise and complaints measure different things. Two independent datasets show the asymmetry directly; the wider literature is mixed, and pretending otherwise would be overselling it.
Responsiveness is the clearest single example — present in 89.03% of one-star reviews versus 24.11% of five-star reviews in Palese and Usai's 2018 study of Italian e-commerce merchants.
Money is the most recurrent complaint thread. Billing and payment failures surfaced near the top in Keaveney (1995), Namkung and Jang (2010) and the 2025 JAMA Network Open review analysis — though headline pricing ranked low in both Yelp datasets, so the issue is surprise charges, not price level.
Product complaints are co-equal, not absent. In the 4.7-million-review Yelp analysis, food-quality complaints ran about 84% as frequent as service complaints, and food-quality sentiment was the strongest rating correlate.
Frequency and impact are different measurements. The same dataset can show service as the most complained-about aspect and food as the biggest rating driver. Both are true.
The salon and home-services literature is essentially missing. No industry benchmark can substitute for reading your own reviews.
Audit before you act. Twenty negatives and twenty positives, tagged by category, will tell you more about your business than any published statistic.