Your Complaint Count Went Up. That Is Not Proof the Fix Failed.
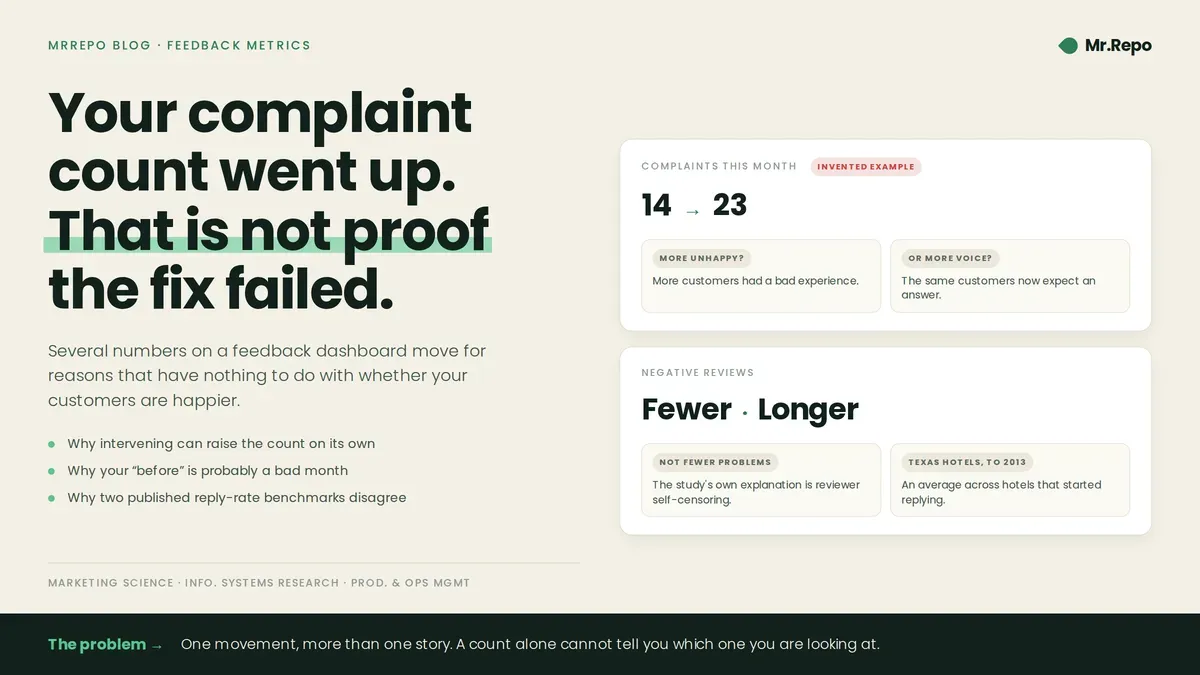
You did the work. You fixed the thing three people complained about. You started answering feedback the same day instead of the following week. Then you opened the dashboard at the end of the month and the complaint count was higher than it was before you started.
That reads as failure. There is research that says intervening can itself raise the count — and, more usefully, that several of the numbers on a feedback dashboard move for reasons that have nothing to do with whether your customers are happier.
We have written before about which metrics to track. This is the other half: what those metrics do when you start acting on them, and which of them cannot answer the question you are asking.
The count can rise because you started answering
The finding this rests on comes from Liye Ma, Baohong Sun and Sunder Kekre, in Marketing Science in 2015. They built a dynamic choice model of customers deciding whether to speak up, and estimated it on "a unique data set of customer voices and service interventions on Twitter."
Their result, in their words: "although service intervention improves relationships, it also encourages more complaints later." And the consequence they draw from it: "Because of this dual effect, firms are likely to underestimate the returns on service intervention if measured using only voices."
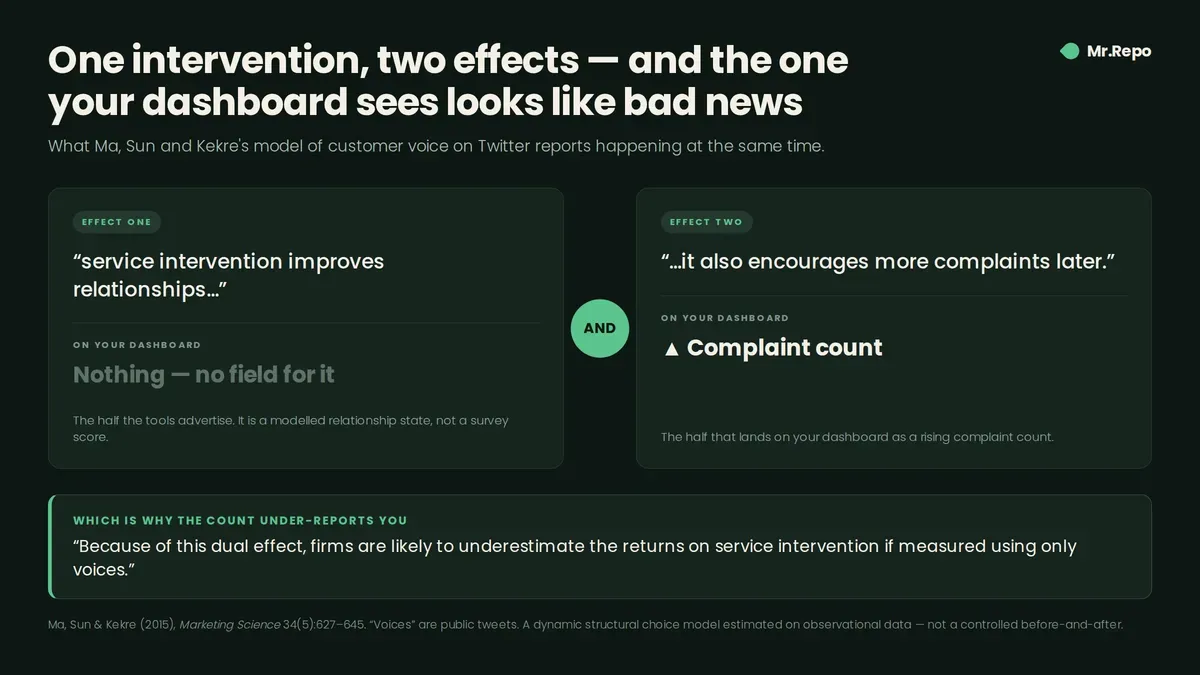
It does not say your customers are having more bad experiences. It says a customer who has learned that complaining gets a response becomes more willing to complain again. The authors also find that "redress seeking is a major driver of customer complaints" — people speak up because they want something fixed, not only because they are upset.
Two limits travel with this study and both matter. The "voices" in it are public tweets, so the finding is about a public channel, not about a private feedback form. And it is a structural model estimated on observational data, not a controlled before-and-after. What it tells you is that a rise in complaint volume is not, on its own, evidence that anything got worse. It does not tell you that a rise is good news either.
Your baseline may be a low point
There is a second reason the numbers look strange, and it has nothing to do with customers. It is about when businesses start.
Davide Proserpio and Georgios Zervas, in Marketing Science in 2017, studied hotels that began replying to reviews. They report that "hotels are likely to start responding following a negative shock to their ratings."
That is a description of hoteliers, and we would not assume it generalises to salons or clinics without a study that looked at them. But the pattern is familiar. The month you start measuring may be the month after something went wrong — in which case your baseline is a low point, and some of the improvement that follows would have arrived whether you acted or not.
It makes a before-and-after on your own dashboard a weak test of your own work: the "before" was chosen by the thing that upset you.
The reviews changed shape, not the experience
The same paper contains a result that gets quoted in half. Proserpio and Zervas found "a 0.12-star increase in ratings and a 12% increase in review volume for responding hotels" — and, alongside it, that "when hotels start responding they receive fewer but longer negative reviews."
The truncated version — responding gets you fewer negative reviews — drops the authors' own explanation, which is that "unsatisfied consumers become less likely to leave short indefensible reviews when hotels are likely to scrutinize them." The mechanism they propose is self-censoring by the reviewer. Nothing in it says the hotel produced fewer bad experiences. The authors summarise the trade-off as "fewer negative ratings at the cost of longer and more detailed negative feedback."
Two more constraints. The estimate is deliberately narrow: "instead of estimating an ATE, our goal is to consistently estimate an average treatment effect on the treated (ATT)" — an average across hotels that actually started responding, not a promise of what happens to you. And the data are reviews of Texas hotels on TripAdvisor and Expedia — travel platforms — running through December 2013, over a decade ago. We covered this study in full in what actually changes when you start replying.
One more study belongs next to it. Wei Chen, Bin Gu, Qiang Ye and Kevin Xiaoguo Zhu, in Information Systems Research in 2019, found that "managerial responses indeed have a significant and positive impact on the volume of subsequent customer reviews" but that "the impact on the review valence is not evident" — a result they attribute to the identity-disclosure design of the platform they studied, which is a caveat, not a general law. One study finds a rating move; the other reports no evident effect on valence. Both results are in the literature.
A complaint that goes private is still a complaint
If your dashboard counts public complaints, then a customer choosing to message you instead of posting looks identical to a customer who was never unhappy.
Whether customers want that private channel is contested. He, Lee and Rui, writing in Production and Operations Management in 2026, ran a randomised survey experiment set up so that "the inconvenience of the private channel with the treated firm is suddenly eliminated," and still "find evidence that customers prefer to complain through the public channel." They also note firms "increasingly turning to private messaging." In an earlier, open-access working paper version of the same research programme, the authors report that firms prioritise complaints arriving through the private channel over public ones.
The operational point survives either way: private and public complaint volume are two different counts, and one falling while the other rises is a redirection rather than an improvement — though in that survey experiment customers still said they preferred the public channel. We found no peer-reviewed study measuring what happens to private feedback volume when a business starts collecting it.
"How many unhappy customers complain" is not a constant
A figure saying that only about four percent of unhappy customers ever complain circulates in reputation marketing. It is usually attributed to a 1979 report prepared for the US Office of Consumer Affairs by Technical Assistance Research Programs. That report exists — it is catalogued at 238 pages — but its full text sits behind a paywall at NTIS, and we have not been able to read the four percent figure in a primary document.
What we could read is an article by one of that report's authors. Goodman and Newman, writing in Quality Progress in January 2003 — a trade magazine, not a peer-reviewed journal — give different figures for different situations, not one rate. "For small problems… only 3% of consumers complained." In a case that could have cost an average $142, roughly 31% of the people who hit the problem did not complain, meaning most of them did. Among business customers, "37% of the companies that encountered problems did not complain to anyone".
Those numbers point in different directions for a reason: in Goodman and Newman's own account the rate differs with the size of the loss. A single percentage applied to your business is answering a question their figures do not settle.
The older survey evidence is similarly conditional. Arthur Best and Alan Andreasen, in Law & Society Review in 1977, reporting a 1975 US survey, found that consumers voiced complaints "concerning about one-third of those problems" they encountered — per problem, not per customer.
Numbers about other people are not measurements of you
Two kinds of number get read as a measurement of your business when they are not.
The first is survey preference. BrightLocal's 2026 Local Consumer Review Survey, of 1,002 US adults, reports that 89% expect owners to respond to reviews, 81% within a week, 32% by the following day and 19% the same day. Those are stated intentions collected in a survey: they tell you what people say they expect, not what any customer did.
The second is the industry benchmark. Two datasets on how often businesses reply to Google reviews are in circulation and they do not line up. SOCi, covering 31,326 Google Business Profile locations and 4,936,814 reviews from 53 multi-location brands between January 2015 and 31 July 2022, reports: "The highest response percentage in our study was 23.4 percent for reviews with a rating of 5 stars, followed by responses to a business' 1-star reviews at 8.6 percent, 4-star reviews at 4.6 percent, 2-star reviews at 3.3 percent, and 3-star reviews at just 2.0 percent." UENI, a vendor serving small businesses, publishing in August 2026 on 229,882 self-selected reviews from its own customer base, reports 5★ 29.3%, 2★ 13.9%, 4★ 12.9%, 3★ 10.2% and 1★ 9.8%.
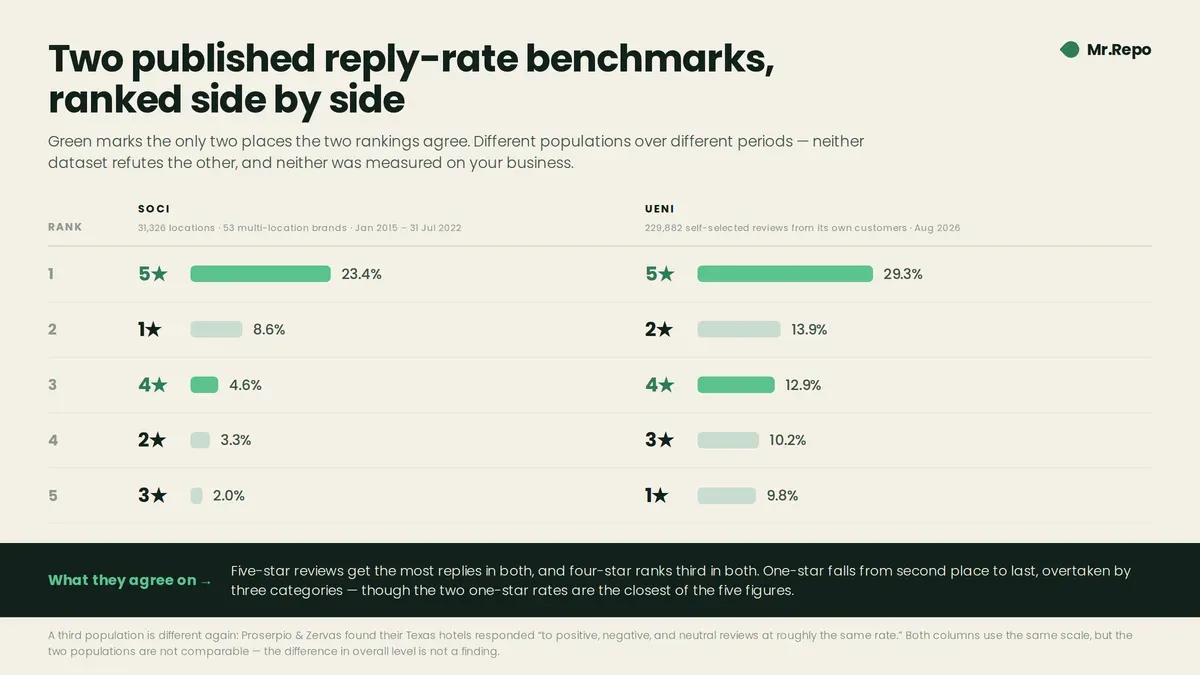
They agree on two things: five-star reviews get the most replies in both, and four-star reviews rank third in both. Otherwise one-star falls from second place to last, overtaken by three categories — though the two one-star rates are the closest of the five figures, 8.6% against 9.8%. The two sets cover different populations over different periods; the SOCi window closed in 2022 and UENI's opened in 2025, and neither refutes the other. And Proserpio and Zervas's hotels are a third pattern again: those hotels responded "to positive, negative, and neutral reviews at roughly the same rate."
Three sources, three shapes — and none of the three was measured on you.
Reading your own numbers
These rules are our own working heuristics rather than findings, though two of them lean on the studies above. They are how we would read a small business's feedback dashboard.
Never read a count on its own; read it against what you changed. A complaint count is a count of people who spoke up, and Ma, Sun and Kekre's Twitter model finds that intervening can raise it. Write down what you changed and when, before the number moves.
Count public and private feedback separately, and look at the total. A drop in one alongside a rise in the other is a channel shift, and even the total misses everyone who stayed silent.
Choose a baseline that is not a bad month. If you started measuring after a bad month, compare against the same month last year, or against a rolling three-month average, rather than against the trough.
Treat a small monthly sample as a direction, not a figure. Percentages off a few dozen responses carry a wide margin of error; we worked through the arithmetic in the review benchmarks you won't find for your business.
Ask what a metric would look like if you were wrong. If a number can only move one way when things improve, and also moves that way when things get worse, it is not measuring what you think.
Where MrRepo's numbers sit in this
MrRepo's dashboard shows satisfaction, scan volume and sentiment themes, and its private feedback inbox is separate from the public reviews a customer chooses to leave. Because the QR prompt shows both options at the same moment, the private inbox and the public review count are two different numbers you can watch move independently, rather than one number standing in for both.
What it cannot do is tell you which direction is good, because the research above says the same movement is consistent with more than one story. We found no primary dataset giving a benchmark for private feedback volume, so a number that looks low or high against nothing in particular is not evidence either way. What a tool can do is keep both counts in front of you. You can try the interactive demo to see what the two counts look like side by side.
Frequently asked questions
My complaints went up after I started asking for feedback. Should I stop asking? Not on that evidence alone. Ma, Sun and Kekre found in a model of public complaints on Twitter that service intervention "encourages more complaints later" while also improving relationships. That study is about a public channel and is not a controlled experiment, so it does not prove your rise is harmless — but a rise in the count is not, by itself, evidence that more customers are unhappy.
Does replying to reviews raise my rating? The evidence is mixed. Proserpio and Zervas found a 0.12-star increase for responding hotels — an average treatment effect on the treated, in Texas hotel data ending in 2013. Chen, Gu, Ye and Zhu found review volume rose but "the impact on the review valence is not evident" — a null they credit to that platform's identity disclosure. Neither result is a measurement of your business.
Is it true that only 4% of unhappy customers complain? We cannot verify it. The figure is usually attributed to a 1979 report for the US Office of Consumer Affairs whose full text we have not been able to read. One of that report's authors later gave, in a trade magazine, different figures for different situations: 3% on small problems, and most customers complaining where the average loss could reach $142. Treat any single complaint rate as a guess.
Private feedback is up and public reviews are down. Is that good? It means fewer people chose the public channel this period. Whether fewer people were unhappy is a separate question that neither count answers alone. Look at the combined total, at what changed in how you ask — and remember that the total misses silent customers.
How many responses do I need before a percentage means something? More than a few dozen. The arithmetic is in our post on review benchmarks.
Key takeaways
A rising complaint count is ambiguous. In Ma, Sun and Kekre's model of public complaints, service intervention improves relationships and encourages more complaints later — so volume alone cannot tell you which happened.
Your baseline may be a trough. Proserpio and Zervas found Texas hotels tend to start responding after a negative shock to their ratings. If you started the same way, part of any improvement may be the starting point rather than the work.
"Fewer negative reviews" is not what that study found. In Texas hotel data ending in 2013 it found fewer but longer negative reviews, attributed to unhappy consumers self-censoring — not to fewer bad experiences.
Public and private complaints are different counts. One falling while the other rises is a redirection, and we found no peer-reviewed study measuring what private feedback volume does when a business starts collecting it.
Survey expectations and vendor benchmarks are not measurements of you. Stated intentions describe what people say; two reply-rate datasets, from different populations and periods, agree on two of five rankings.